
🗣️Data Visualization Assistant
- Launched an AI-powered app using Streamlit, with a strong emphasis on data visualization.
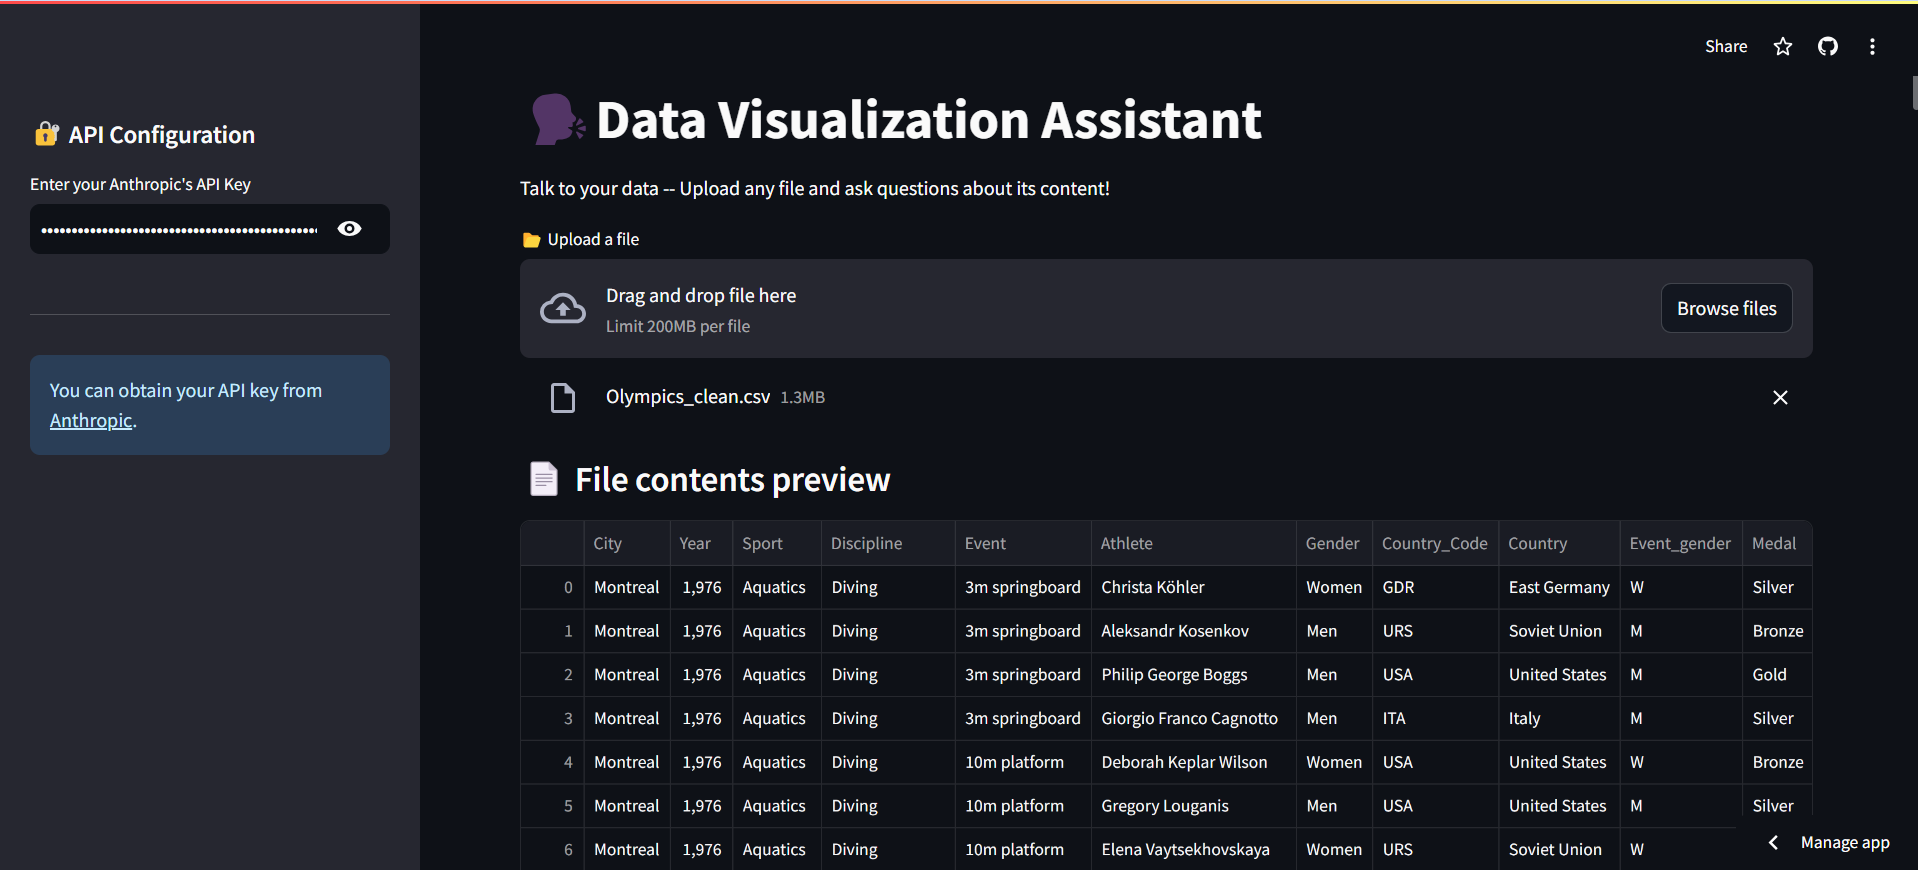
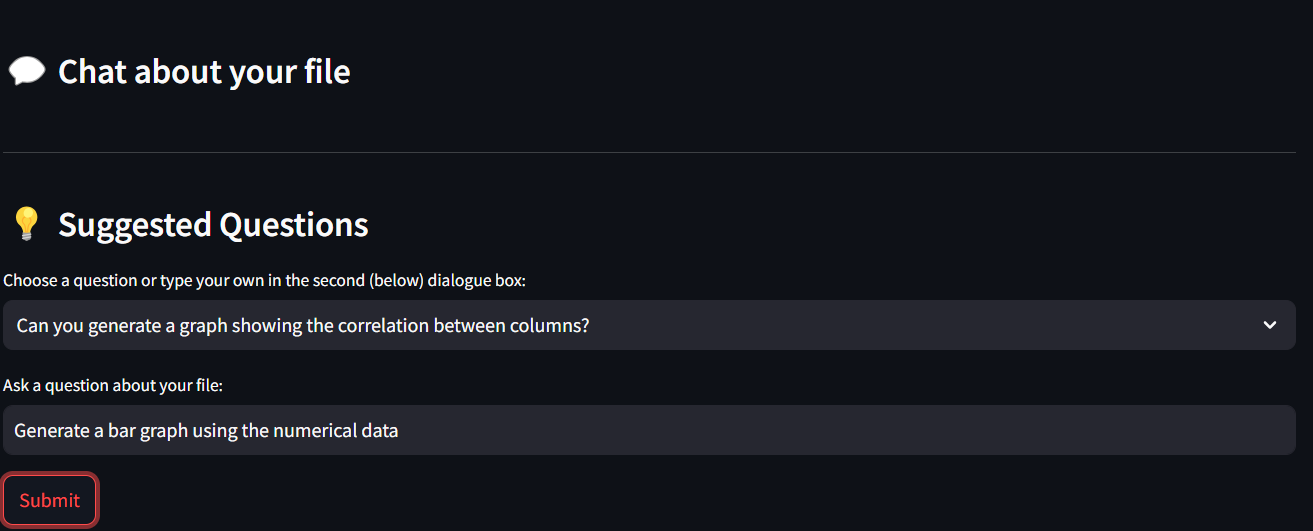
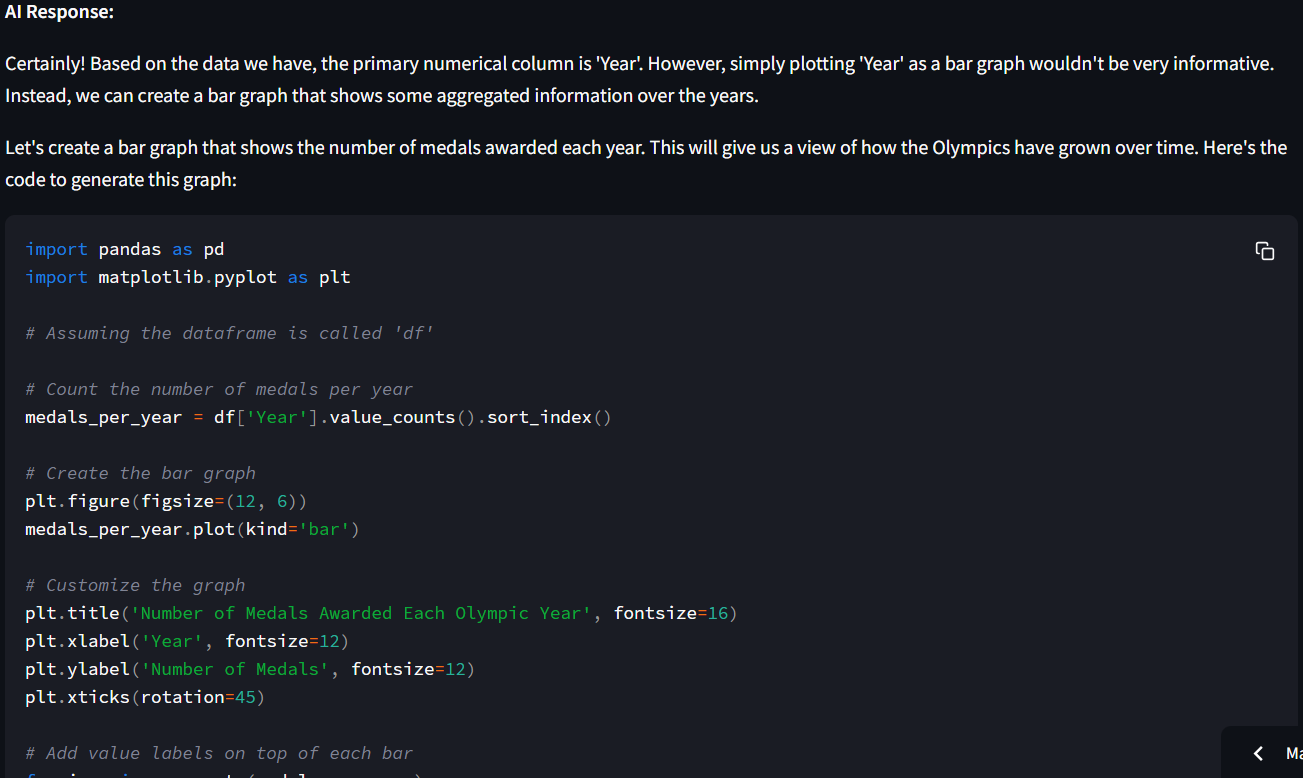
- Integrated Anthropic’s Claude for natural language processing to facilitate user interaction with data in CSV, PDF, and DOCX formats.
- Developed interactive UI elements for data previews and dynamic visualizations, making complex data insights accessible.
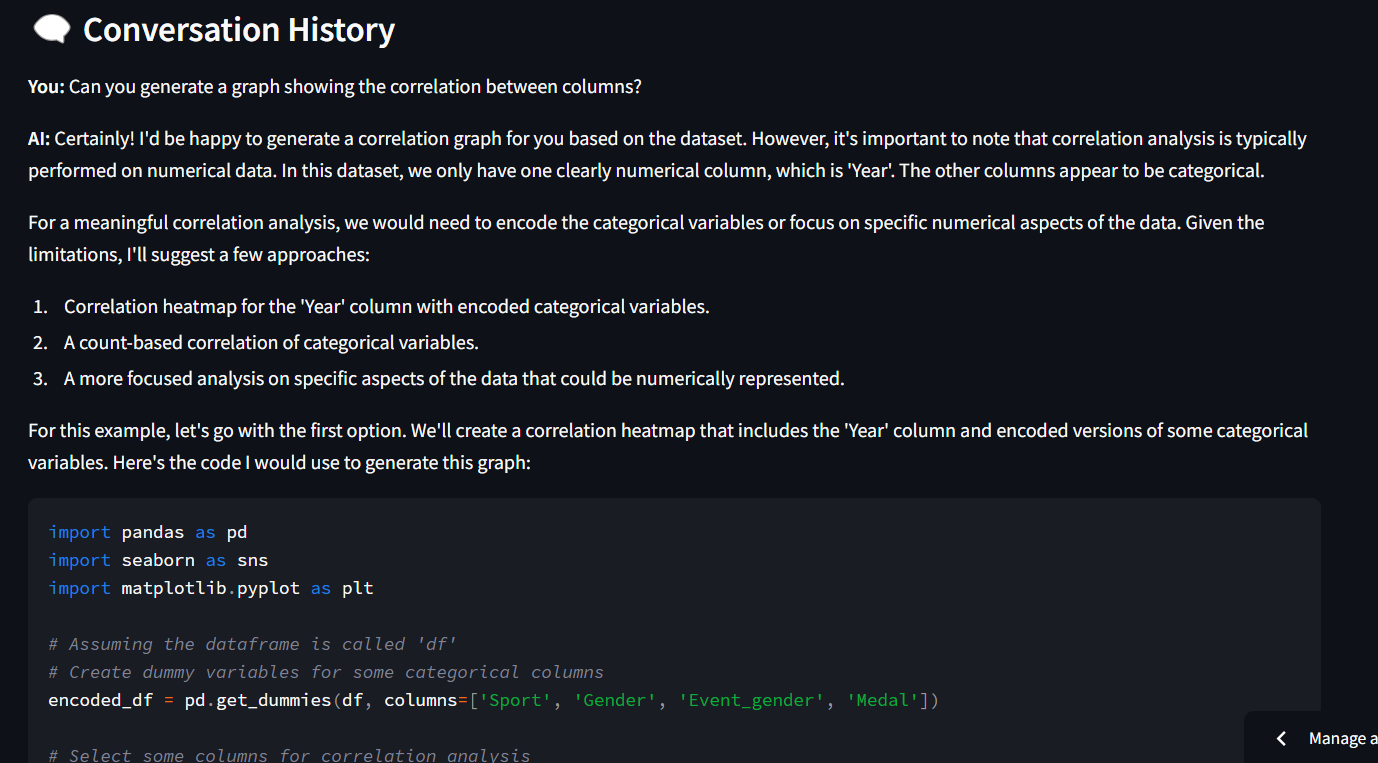
- Managed session state to maintain conversation history and context throughout the user interaction.
- Ensured secure API key authentication to protect access to AI services.
✦ Code: 
✦ Medium blog: