
🎖️From Data to Gold: My Journey Creating an Olympic Tableau Dashboard
- Developed an interactive dashboard using Tableau with Kaggle’s Olympic dataset.
- Enhanced data quality by cleaning and transforming dataset attributes for better insights.
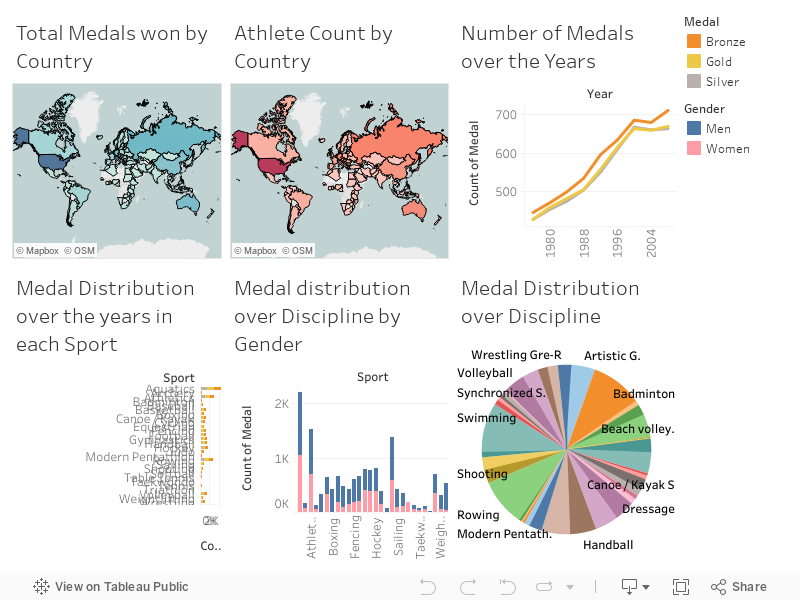
- Visualized medal counts by country and tracked athlete participation trends.
- Analyzed event evolution and sports discipline distribution through dynamic charts and maps.
✦ Medium blog: 
✦ Code: 