
🧬Single cell RNA sequencing
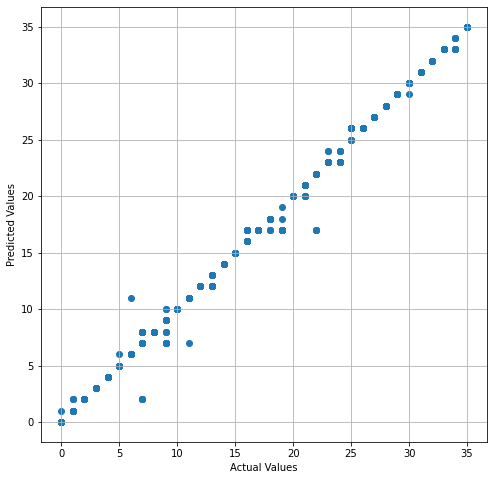
- Identified important cells among the dataset and ranked in a hierarchy using k-means clustering and Logistic Regression.
- The dataset comprised 2169 cells taken from the neocortex region of a rat’s brain and distributed in 20,000 columns. Principal Component Analysis was used to reduce 20,000 columns to 3-5 components.
- Visualized the output data through a dynamic 3-D graph using Plotly.
- Achieved an accuracy of 89.8%.
✦ Code: 
✦ Report: